News
[Blog] Setting up Analytics through Prometheus and Grafana
Hey Everyone! Balder here, this time I wanted to talk about using Prometheus and Grafana to set up analytics collection within MistServer. There’s actually quite a lot of statistics available and while we do tend to help our Enterprise customers to set this up it’s actually available for our non-commercial users as well and easily set up too.
Best practises for setting up your analytics server
As you might have guessed using Prometheus and Grafana will require some resources and we recommend running it on a different device than you are running MistServer on. This is for a few reasons, but the most important being that you would want your analytics collection to keep going if your MistServer instance goes dark for some reason or has run into trouble.
As such we would recommend setting up a server whose sole focus is to get the analytics from your MistServer instances. It can be any kind of server, just make sure it has access to all your MistServer instances.
Operating system choice
While this can be run in almost every operating system, a clear winner is Linux.
Under Linux both Prometheus and Grafana work with little effort and will become available as a service with their default installs. Mac comes in second as Prometheus works without too much trouble, but Grafana requires you to use the homebrew package manager for MacOS. Windows comes in last as I couldn’t get the binaries to work without a Linux simulator like Cygwin.
Installing Prometheus and Grafana
Linux
Installing both Prometheus and Grafana under linux is quite easy as they're both quite popular. There's a good chance they're both available as a standard package immediately. If not I recommend checking their websites to see how the installation would go for your Linux Operating System of choice.
Starting them once installed is done through your service system which is either:
systemctl start grafana.service
or
service grafana start
depending on your Operating system.
MacOS
Installing Prometheus can be done rather easy. The website provides Darwin binaries that should work on your Mac. It can also be installed through Homebrew which we will be using for Grafana. Which method you use is up to you, but I prefer to work with the binaries as it made using the configuration file easier for me.
Install Homebrew as instructed on their website.
Then use the following commands in a terminal:
brew update
brew install prometheus
Installing it as a service would be preferred, but I would recommend leaving that until after you've set everything up.
Installing Grafana can also be done through Homebrew. The Grafana website offers some excellent steps to follow in order to install it properly.
For Prometheus you will have to make your own service to have it automatically start on boot. Installing Grafana through Homebrew will make it available as a service through Homebrew.
Windows
Both Prometheus and Grafana offer Windows binaries, however I could not get them to work natively in Windows 10. They did instantly work when I tried running them in the Cygwin terminal.
Because of the added difficulty here I would just run them both in a Cygwin terminal and be done with it, though you could try to run them as a system service. The combination of Cygwin and Windows Services tend to cause odd behaviour however, so I can't exactly recommend it.
Setting up Prometheus and Grafana
01: Editing the Prometheus settings file
This is done by editing prometheus.yml, which may be stored on various locations. You will either find it in the folder you've unpacked, or when installed in Linux, at /etc/prometheus/prometheus.yml or /etc/prometheus.yml
You need to add the following to the scrape_configs:
scrape_configs:
  - job_name: 'mist'
    scrape_interval: 10s
    scrape_timeout: 10s
    metrics_path: '/PASSPHRASE'
    static_configs:
      - targets: ['HOST:4242']
To add multiple MistServers just keep adding targets with their respective HOST.
An example minimal prometheus.yml would be:
scrape_configs:
  - job_name: 'mist'
    scrape_interval: 10s
    scrape_timeout: 10s
    metrics_path: '/PASSPHRASE'
    static_configs:
      - targets: ['HOST01:4242', 'HOST02:4242', 'HOST03:4242']
We did notice that if there's a bad connection between your analytics server and a MistServer instance the scrape_timeout of 10 seconds could be too short and no data will be received. Setting a higher value for the scrape time could help in this scenario.
You can check if this all worked by checking out http://HOST:9090 at the machine you've set this up after you've started Prometheus. Within the Prometheus interface at Status → Targetsyou can inspect whether Prometheus can find all the MistServer instances you've included in your settings.
02: Starting Prometheus
For Linux
systemctl start prometheus.service
or
service prometheus start
or
Use a terminal to go to the folder where you have unpacked Prometheus and use:
./prometheus --config.file=prometheus.yml
For MacOS
Use a terminal and browse to the folder where you have unpacked Prometheus. Then use:
./prometheus --config.file=prometheus.yml
For Windows
Use a command window to browse to the folder where you have unpacked Prometheus. Then use:
prometheus.exe --config.file=prometheus.yml
03: Setting up Grafana
Through your installation method Grafana should be active and available as a service, or if you are using Windows you will need to boot Grafana by starting grafana-server.exe.
Once active Grafana will have an interface available at http://HOST:3000 by default. Open this in a browser and get started on setting up Grafana.
Adding a data source
The next step is to add a data source. As we're running Grafana and Prometheus in the same location, this is quite easy. All we need to set is the Name, Type and URL all other settings will be fine by default.
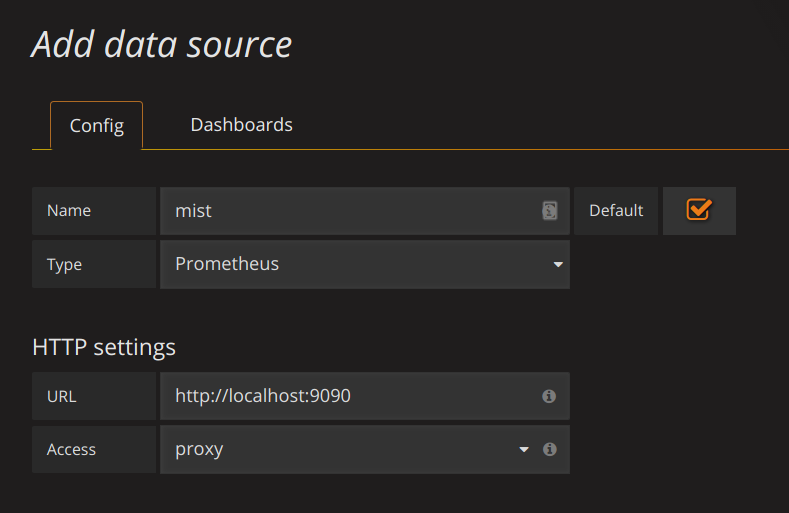
Namecan be anything you'd want.Typehas to be set to:PrometheusURLwill be the location of the Prometheus interface:http://localhost:9090
Add those and you're ready for the next step.
Adding the dashboard
We've got a few Dashboards available immediately which should give the most basic things you'd want. You can add a dashboard by following these steps:
Click on the grafana icon in the top left corner → hover Dashboards → SelectImport`.
You should see the following
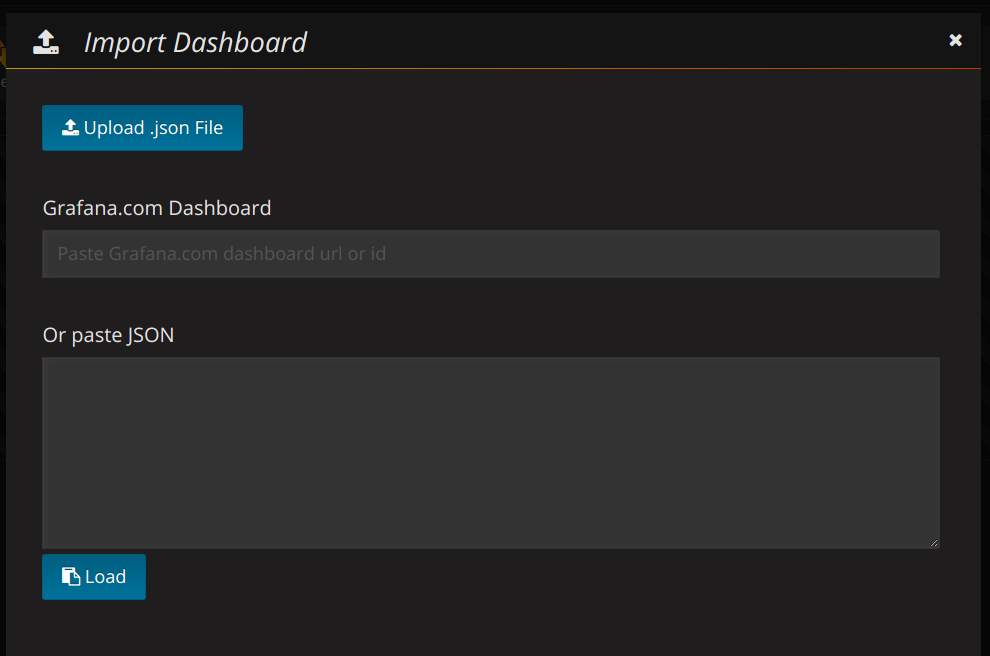
Fill in the Grafana.com Dashboard number with our preset dashboards (for example our MistServer Vitals: 1096)
If recognised you will see the following
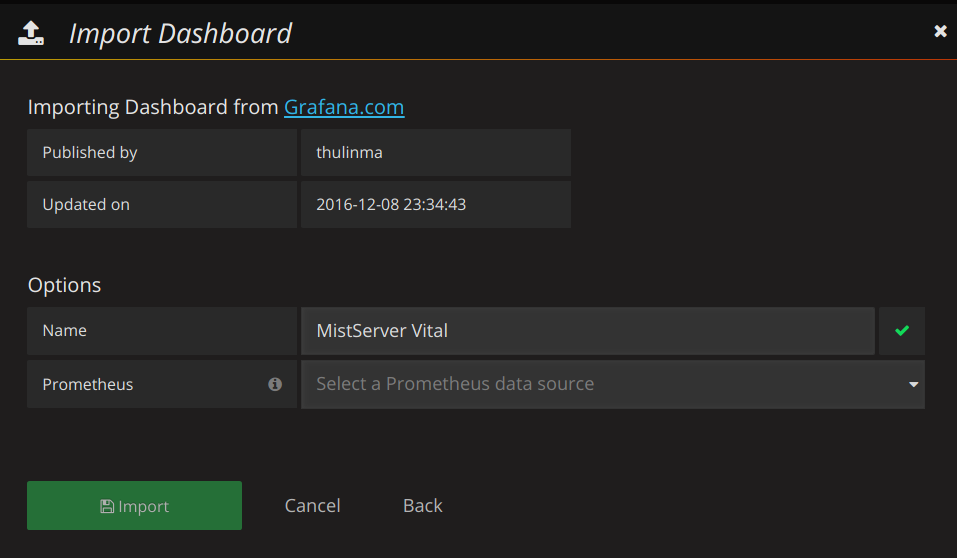
Just add that and you should have your first basic dashboard. Our other dashboards can be added in the same manner. More information about what each dashboard is for can be found below.
MistServer provided dashboards
All of the dashboards can be found here on Grafana Labs as well.
MistServer Vitals: 1096
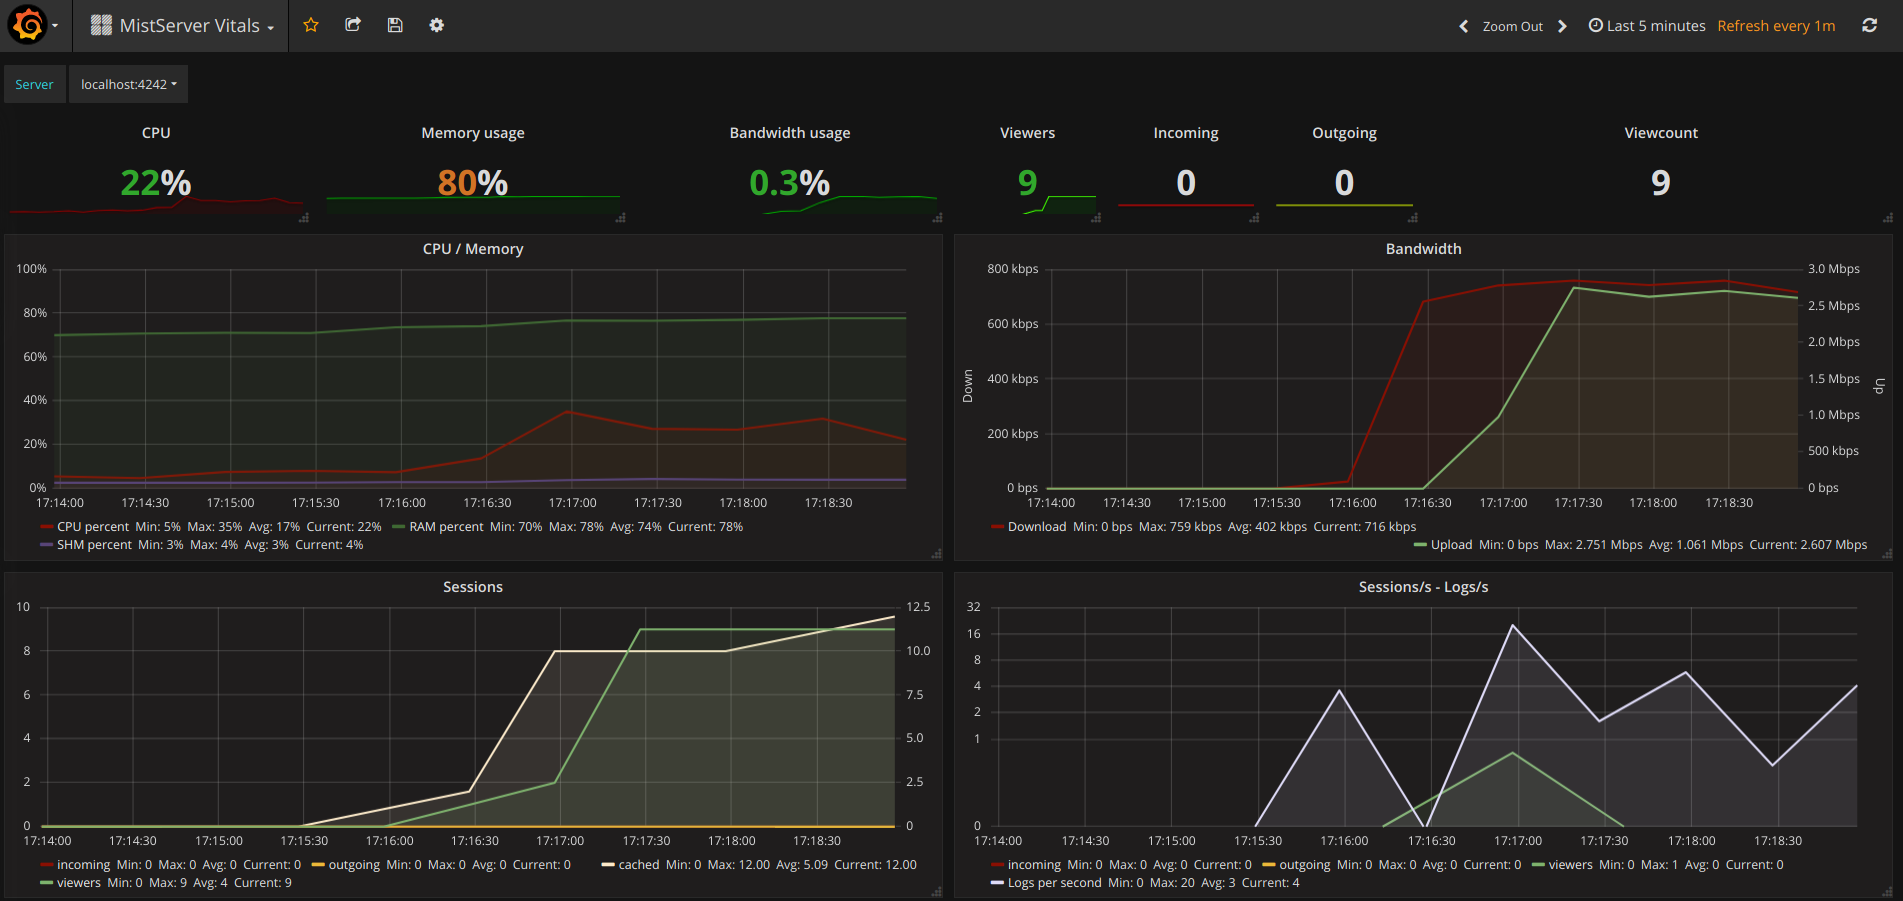
This is our most basic overview which includes pretty much all of the statistics you should want to see anyway. It covers how your server is doing resource and bandwidth wise.
You switch between given MistServers at the top of given panels by clicking and selecting the server you want to inspect.
MistServer Stream Details: 4526
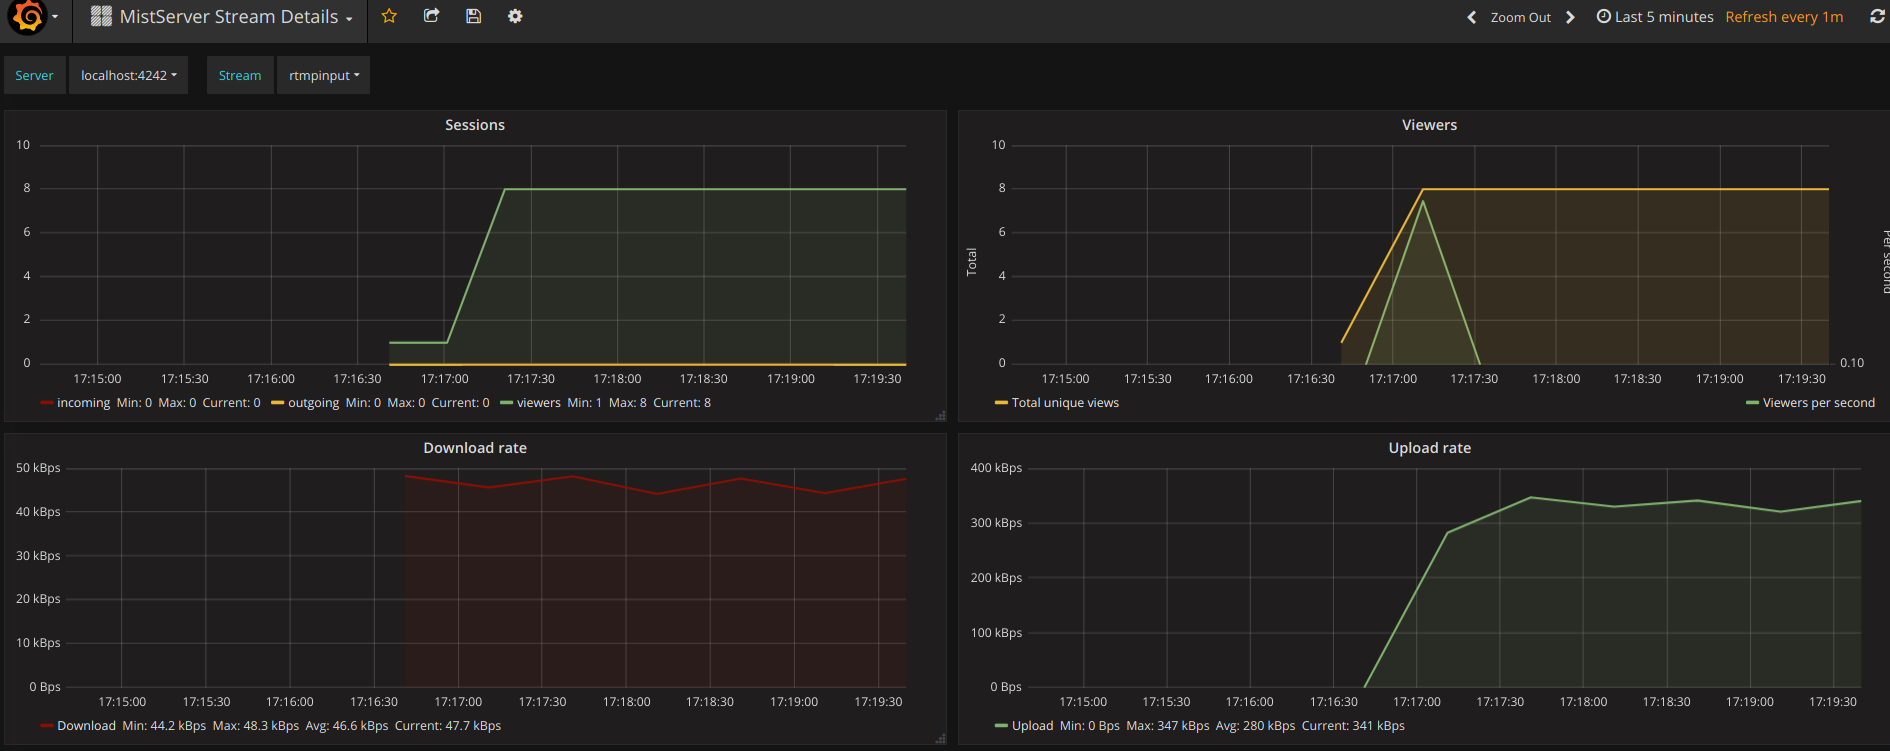
This shows generic details per active stream. Streams and Servers are selected at the top of the panel. You'll be able to see the amount of viewers, total bandwidth use and amount of log messages generated by the stream.
MistServer All Streams Details: 4529
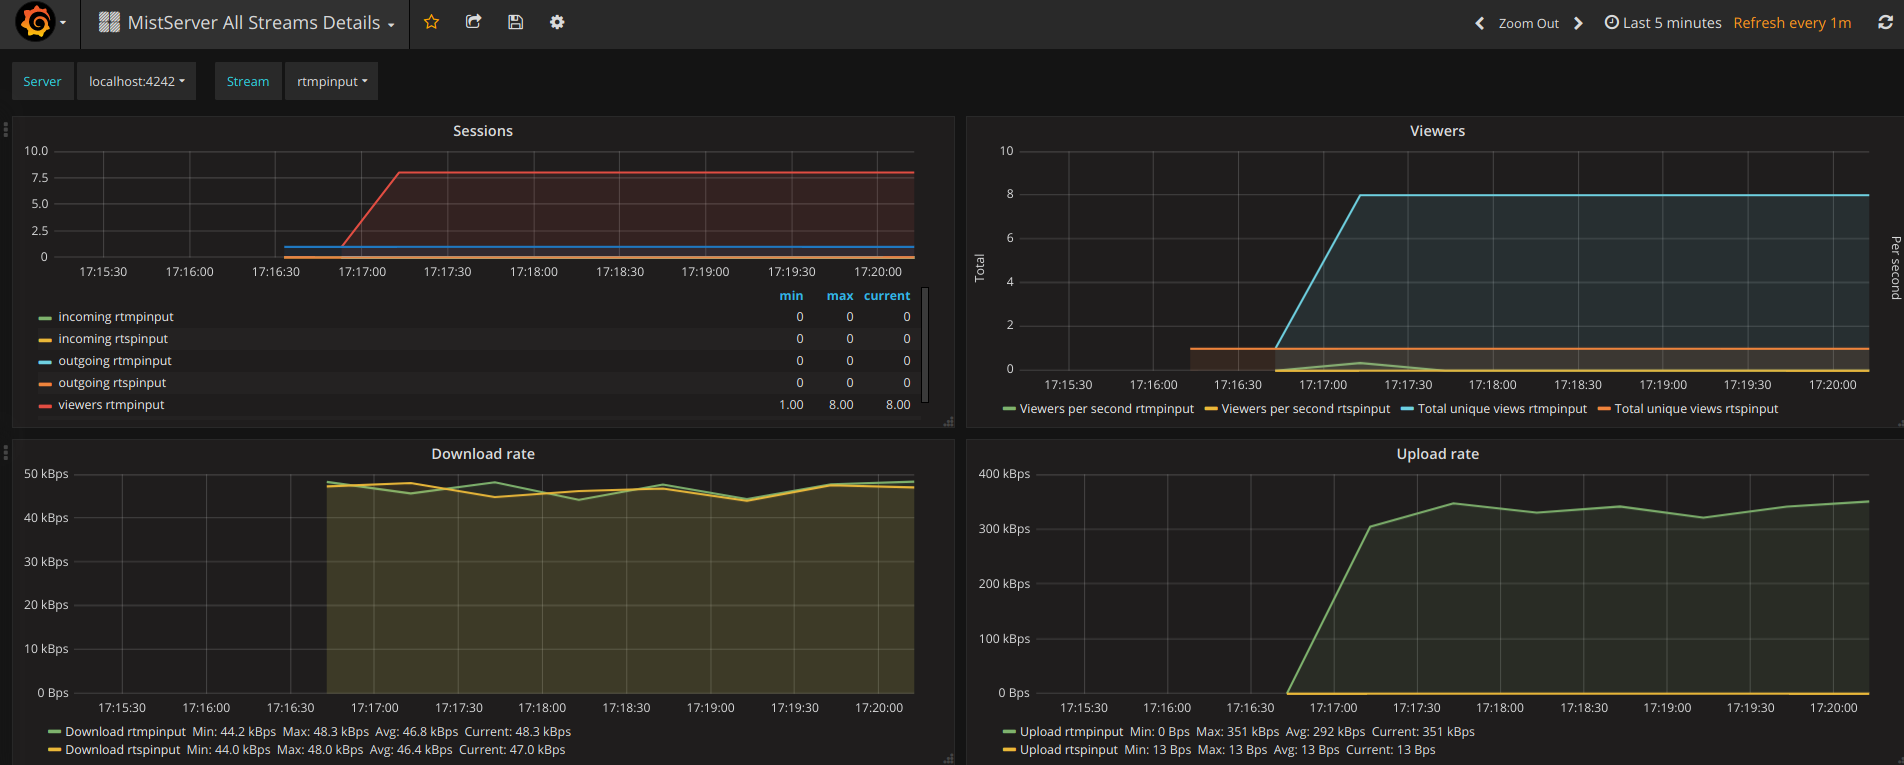
This shows the same details as the MistServer Stream Details Dashboard, but for all streams at the same time. This can be quite a lot of data, and will become unusable if you have a lot of streams. If you have a low amount of streams per server this gives an easy to use overview however.
Well that's it for this blogpost, I hope it's enough to get most of you started on using Prometheus and Grafana in combination with MistServer.